How to Create a Linear Gradient in Canvas (JavaScript) – Interactive Challenge
Linear Gradient
Medium
canvas
math
colors
Build a linear gradient by computing each pixel color from its projection onto a segment.
Goal
Render a smooth linear gradient into ImageData.
The gradient should start as red near the first point and become blue near the second point.
Compute each pixel based on how far is it from start and end points.
Implement the math helpers and fill the image buffer so the final frame draws the generated gradient with ctx.putImageData(...).
JavaScript
Loading...
Preview • sandboxed
Console output
Gradient
Many of us have seen gradient images countless times, and many have also used built-in functions to create gradients in code. But how many have actually thought about how gradient rendering works under the hood 🤔? Let's break it down.
To begin with, in computer graphics, a gradient is a smooth transition from one color to another. There are 2 types of gradients: linear and radial. A linear gradient describes a color change along a straight line. A radial gradient spreads outward from a central point (or ellipse). In this task, we will look at how a linear gradient works.
How it works
A gradient is defined by two points: the start A and the end B.
Each pixel is projected onto line AB to get the normalized distance delta from the endpoints.
delta = 0 means the pixel has the same color as point A.
delta = 1 means the pixel has the same color as point B.
Each color channel (red, green, and blue) is calculated separately using interpolation, that is, by finding an intermediate value.
The resulting rgb value is written into the image at the pixel's coordinates.
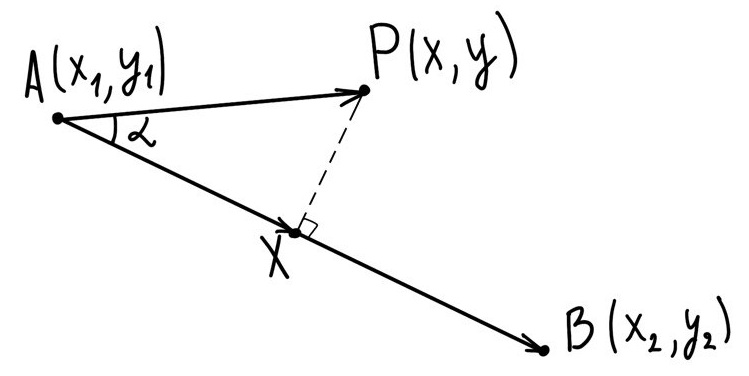
Now let's look in more detail at how to find delta and how to use it. Suppose the starting point A has coordinates (x1,y1) and color (r1,g1,b1), and point B has coordinates (x2,y2) and color (r2,g2,b2). We also have an arbitrary point P on the screen with coordinates (x,y) and color (r,g,b), which is what we need to find. Let X be the projection of P onto AB. This is what it looks like:
From this, the value of delta is:
delta=ABAX
But we do not know the length of segment AX or the length of segment AB. So how do we find delta? This is where vector theory comes in.
Let us consider 3 vectors: AP, AB, and AX. From vector theory, we can represent the dot product AP⋅AB as:
AP⋅AB=∣AP∣⋅∣AB∣⋅cos(α)
Here, ∣x∣ is the magnitude, or length of vector x, and α is the angle between the vectors. The magnitude of vector AX is:
∣AX∣=∣AP∣⋅cos(α)
From this we get:
AP⋅AB=∣AX∣⋅∣AB∣=delta⋅∣AB∣⋅∣AB∣=delta⋅AB⋅AB
So in vector form, we can express delta as:
delta=AB⋅ABAP⋅AB
Now let's convert this formula using the coordinate form of the dot product. We will skip the full derivation to avoid a long theoretical explanation and jump straight to the result:
Since point P may lie outside the rectangle (x1,y1,x2,y2), delta can be negative or greater than one. In that case, we need to use the function clamp(v,min,max), which returns v if v lies within the interval (min,max), or the nearest boundary value otherwise:
deltac=clamp(delta,0,1)
Finally, once we know delta, which tells us how far the point is from the start and the end, we can calculate how much each endpoint color contributes. For this, we use interpolation, meaning we find an intermediate value:
This is how the color of every pixel on the screen is determined.
To fill the screen pixel by pixel, we can use the context function ctx.createImageData. It creates an image with an internal data buffer, which is a one-dimensional array. Every four elements define a pixel's color: data[i]=r, data[i+1]=g, data[i+2]=b, data[i+3]=alpha. The alpha channel defines the pixel's transparency, but we do not need it here, so we set it to 255.
So now we know how to build a linear gradient. Take on the challenge and try implementing this algorithm in practice. Good luck 💪.